Categories
Data Engineering Datawarehouse

Navigating the Data Seas: Unraveling the Landscape of Data Architectures

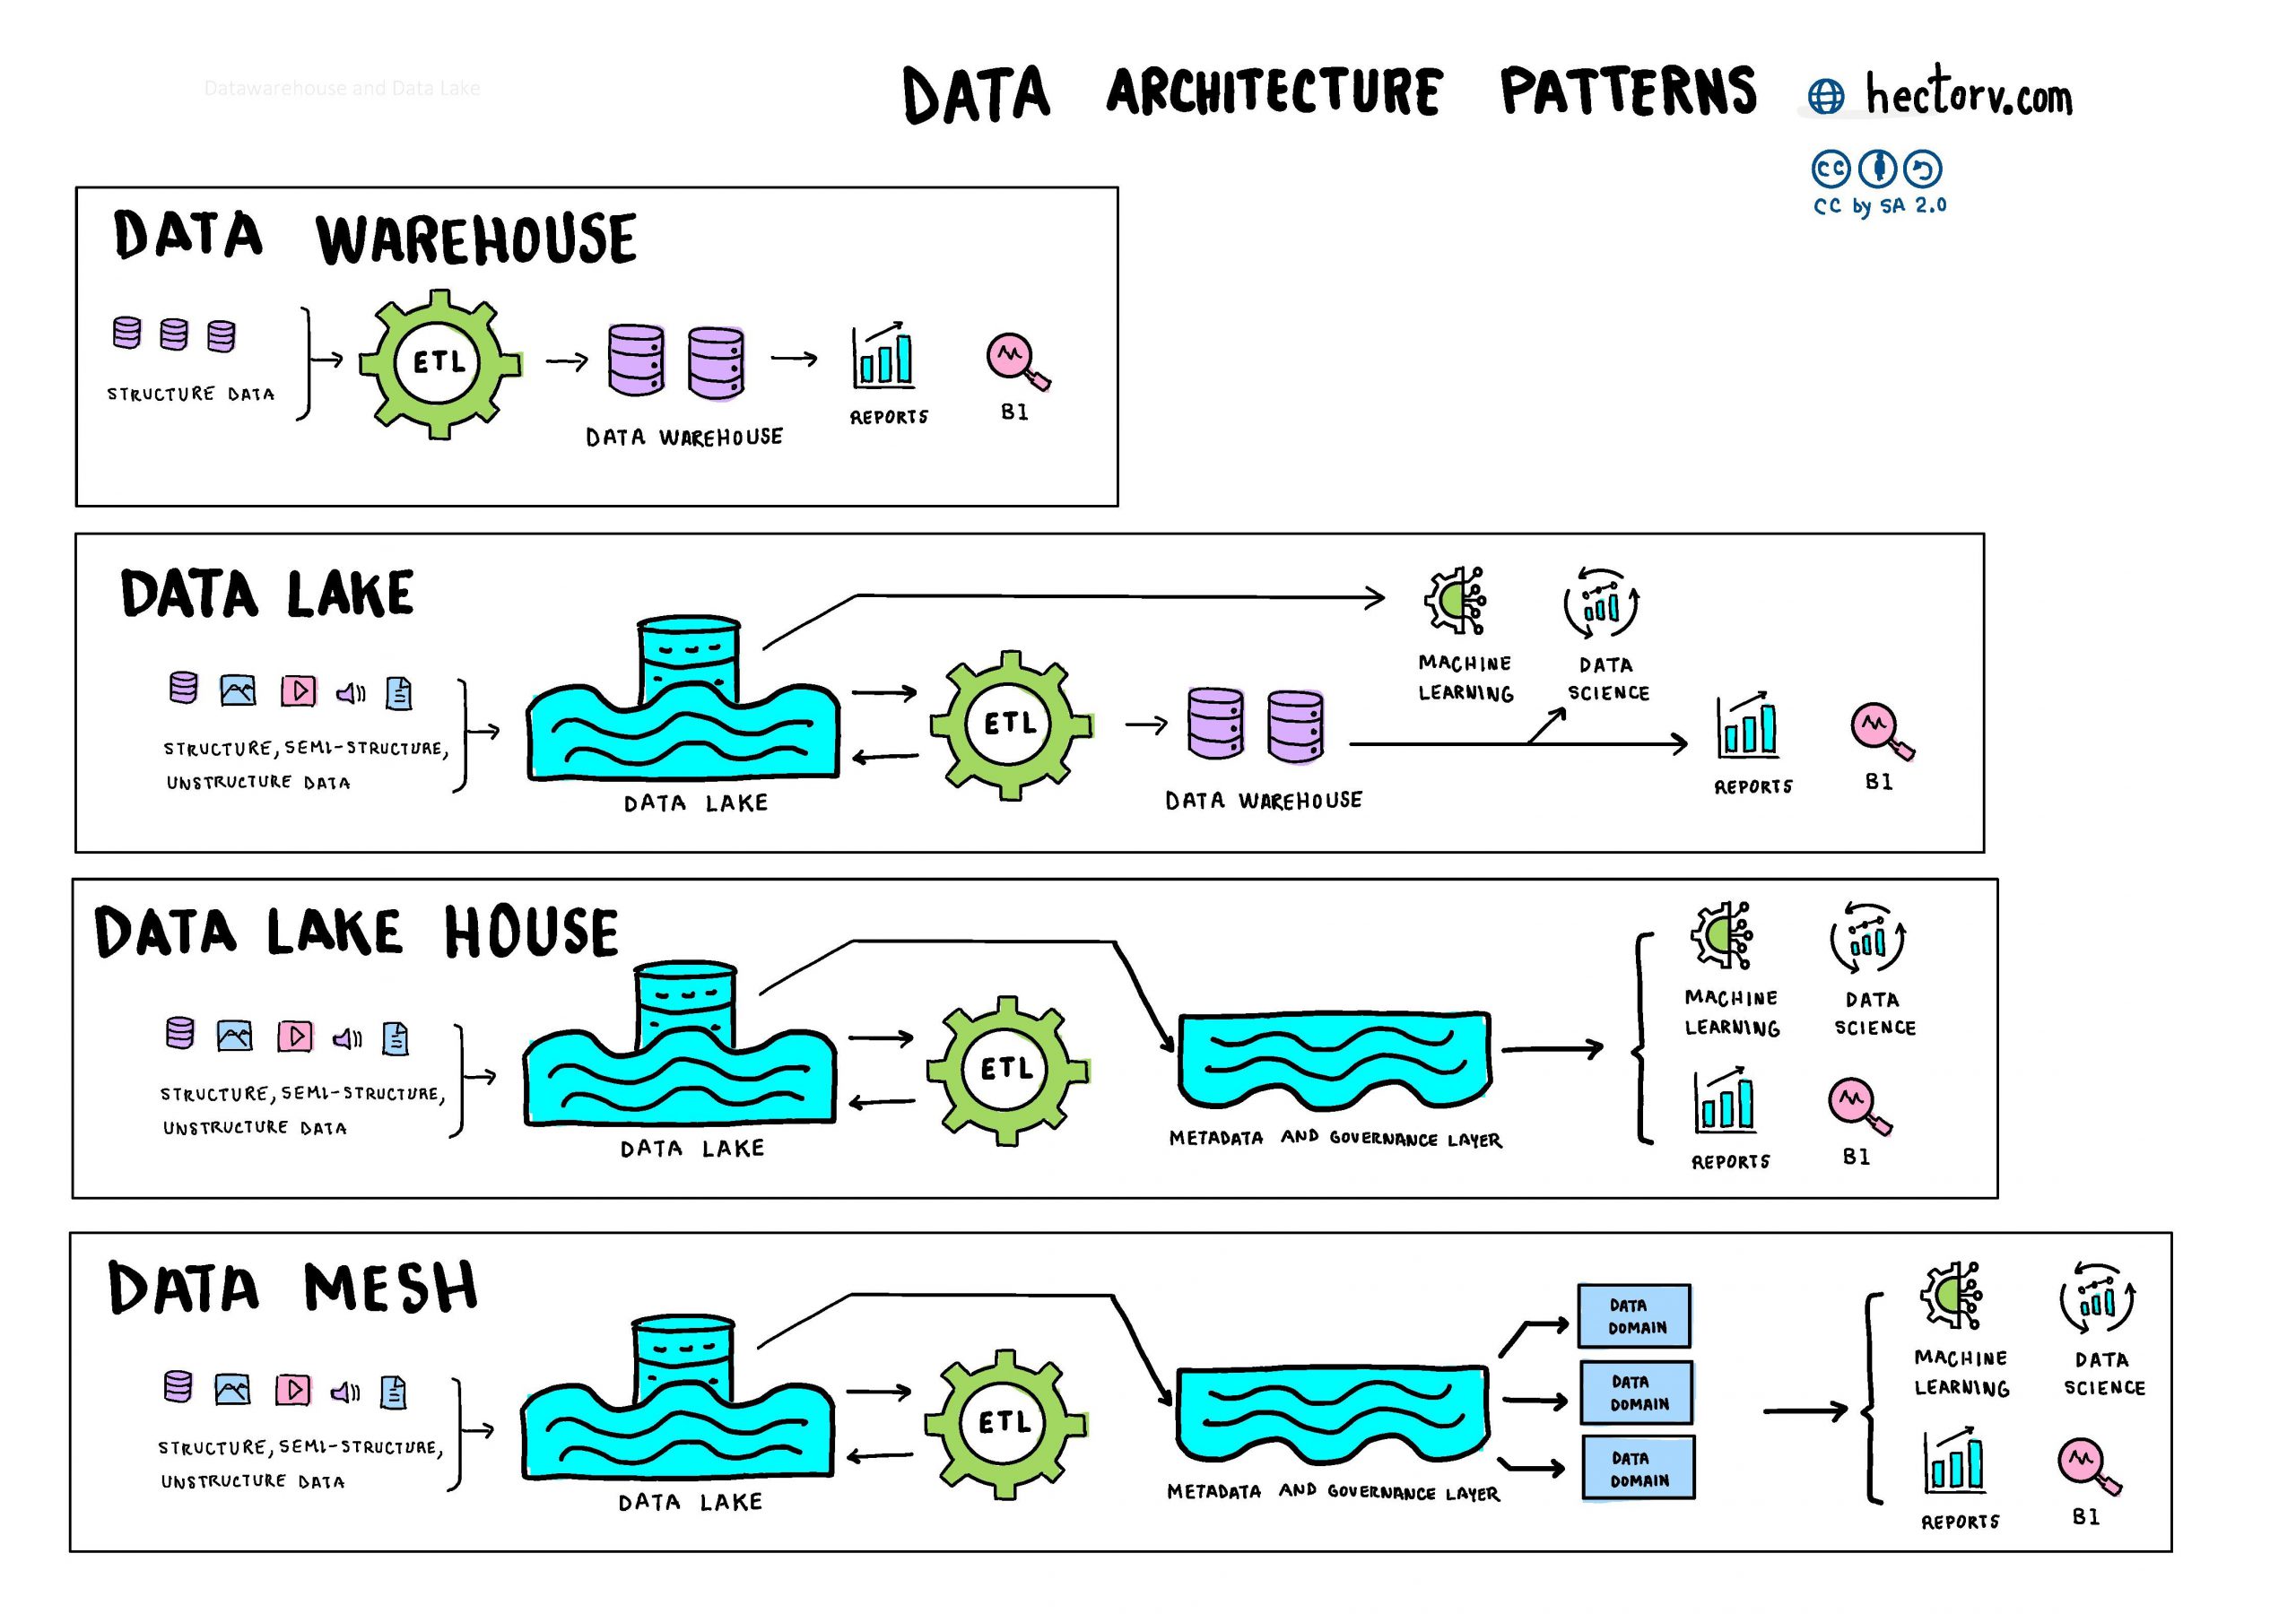
In the ever-evolving landscape of data management, organizations wrestle with an array of architectural patterns to make sense of the vast ocean of information. Let’s embark on a journey through four key paradigms: Data Warehouse, Data Lake, Data Lakehouse, and the decentralized marvel known as Data Mesh.

Data Warehouse: The Backbone of Structured Insights

At the core of every data-driven enterprise stands the Data Warehouse, a structured backbone that has long been a cornerstone for analytical prowess. This architectural marvel is akin to a meticulously organized library, where each piece of structured data is neatly cataloged and readily accessible.

Key Features:

  • Centralization: Acting as a centralized repository, Data Warehouses integrate structured data from diverse sources, providing a unified view.
  • Schema-on-Write: Data is structured and organized before being loaded through ETL processes, ensuring a consistent and reliable foundation.
  • SQL Dominance: Powered by SQL queries, Data Warehouses excel in supporting business intelligence (BI) and reporting applications, generating insightful reports.

Data Lake: The Uncharted Reservoir of Possibilities

In contrast to the structured rigidity of a Data Warehouse is the uncharted wilderness of a Data Lake. Imagine a vast reservoir collecting data in its raw, unstructured, or semi-structured form. Data Lakes offer unparalleled flexibility, accommodating a diverse range of data formats.

Key Features:

  • Versatility: Data Lakes embrace a multitude of data types, from structured tables to raw text and multimedia.
  • Schema-on-Read: Raw, semi-structured, and unstructured data is ingested as-is, allowing for on-the-fly structuring during analysis, promoting adaptability.
  • Scalable Storage: Built on scalable distributed storage systems, Data Lakes handle massive volumes of data with ease. ETL processes may still be employed for data integration with Data Warehouses.

Data Lakehouse: Harmonizing Structure and Flexibility

As organizations sought to bridge the structured elegance of Data Warehouses with the flexibility of Data Lakes, the concept of Data Lakehouse emerged. This integration of structured and raw data provides a comprehensive solution for varied analytical needs.

Key Features:

  • Unified Platform: A holistic approach combining structured and unstructured data within a single platform, often involving ETL processes to maintain data integrity.
  • Agile Analytics: Enables agile analytics by allowing organizations to draw insights from both raw and curated data, fostering machine learning and data science initiatives.
  • Hybrid Processing: Supports both batch processing for historical analysis and real-time processing for up-to-the-minute insights. Metadata and governance layers ensure proper management and control.

Data Mesh: Decentralized Empowerment

In the era of decentralized architectures, Data Mesh emerges as a revolutionary concept. Rather than relying on a centralized data monolith, Data Mesh advocates for a domain-oriented, decentralized approach, transforming data into a product that is owned by a specific domain.

Key Features:

  • Domain-Oriented Teams: Data ownership and governance are distributed across domain-oriented teams, fostering autonomy.
  • Federated Architecture: A federated architecture connects distributed data products through well-defined APIs, enabling seamless collaboration. Data domains are crucial for understanding and managing the varied data structures.
  • Decentralized Governance: Each domain team governs its data products, ensuring relevance, quality, and compliance. Machine learning, BI, and reports are empowered by decentralized data initiatives.

Tools

Tools commonly used in various data architecture patterns categorized by the roles or functions they serve:

  • Data Ingestion and Integration:
    • Apache Nifi
    • Apache Kafka (for real-time data streaming)
  • ETL (Extract, Transform, Load):
    • AWS Glue
    • Azure Data Factory
    • Apache NiFi
    • Apache Airflow
    • SQL Server Integration Services (SSIS)
  • Data Lake Storage:
    • Amazon S3
    • Azure Data Lake Storage
    • Hadoop Distributed File System (HDFS)
    • Databricks
  • Data Processing and Analytics:
    • Apache Spark
    • Databricks
    • Amazon Redshift
    • Snowflake
    • Google BigQuery
    • Azure Synapse
  • Data Warehousing:
  • Data Processing and Analytics:
    • Tableau
    • Power BI
    • MicroStrategy

Conclusion: Crafting a Future of Data Excellence

In the ever-evolving landscape of data architecture, each pattern contributes a unique thread to the fabric of data excellence. Whether it’s the structured insights of a Data Warehouse, the uncharted possibilities of a Data Lake, the harmonious integration of a Data Lakehouse, or the decentralized empowerment of a Data Mesh, organizations weave these patterns together to navigate the complexities of the data seas and derive meaningful insights. The future of data architecture lies in the artful combination of these paradigms, creating a harmonious symphony of structure, flexibility, and decentralization.

Categories
Datawarehouse Power BI

Power BI: Architecture, components and features

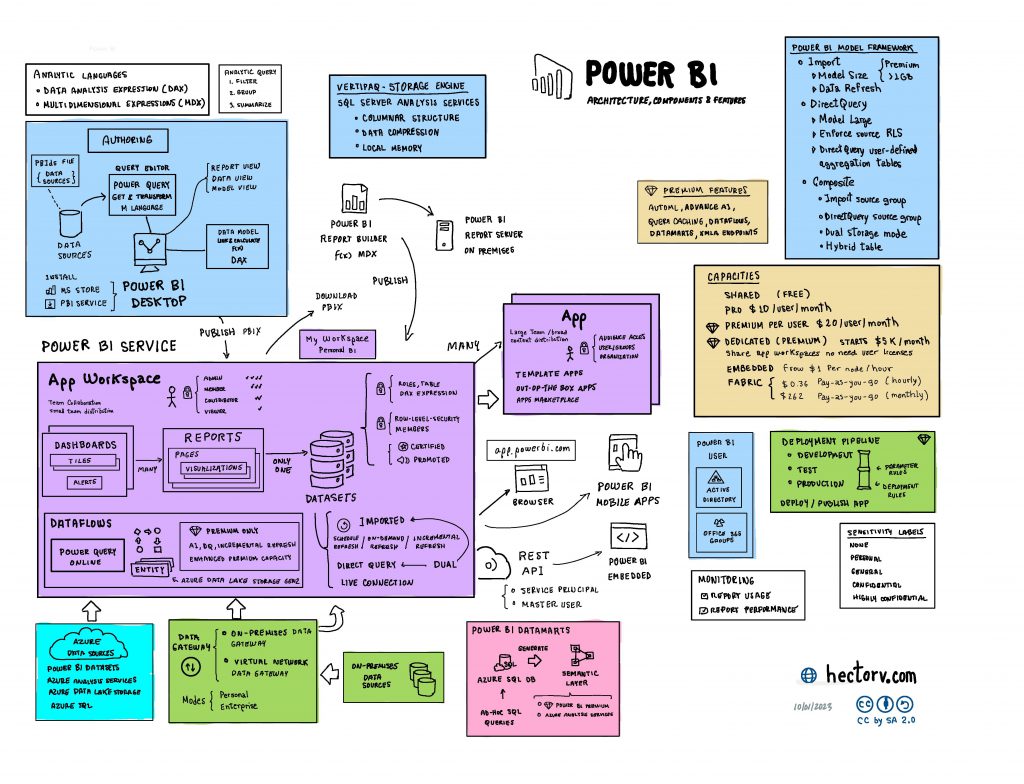
Understanding the complexities of Power BI might occasionally seem like threading through a labyrinth, considering its rich architecture, diverse components, and plethora of features. I’m delighted to present this unique Power BI diagram, which condenses all these facets into a simple, visual representation.

Below is a concise definition for each of these components:

Power BI Desktop
A free application installed on your local computer that lets you connect to, transform, and visualize your data.
Power BI Service
A cloud-based service (also referred to as Power BI online) where you can share and collaborate on reports and dashboards.
Power BI Mobile
A mobile application available on iOS, Android, and Windows that lets you access your Power BI reports and dashboards on the go.
Power BI Gateway
Software that allows you to connect to your on-premises data sources from Power BI, PowerApps, Flow, and Azure Logic Apps.
Power BI Embedded
A set of APIs and controls that allow developers to embed Power BI visuals into their applications.
Power BI Premium
An enhanced version of Power BI that offers additional features, dedicated cloud resources, and advanced administration.
Power BI Pro
A subscription service that offers more features than the free version, like more storage and priority support.
App Workspace
A collaborative space within Power BI where teams can work together on dashboards, reports, and other content, as well as manage workspace settings.
App
A Power BI content package including dashboards, reports, datasets, and dataflows, shared with others in the Power BI service.
Dashboard
A single canvas that displays multiple visualizations, offering a consolidated view usually across numerous datasets.
Report
A multi-perspective view into a dataset, created with a Power BI Desktop and published to the Power BI service.
Paginated Report
Detailed, printable reports with a fixed-layout format, optimized for printing or PDF generation.
Power BI Dataset
A collection of related data that you bring into Power BI to create reports and dashboards.
Power Query
A data connection technology that enables you to discover, connect, combine, and refine data across a wide variety of sources.
Dataflows
A cloud-based data collection and transformation process that refreshes data into a common data model for further analysis.
Imported Mode
A data connection mode in Power BI where data is imported into Power BI’s memory, allowing for enhanced performance at the cost of real-time data refresh.
Direct Query Mode
A data connection mode in Power BI where queries are sent directly to the source data, allowing for real-time data analysis.
DAX (Data Analysis Expressions)
A collection of functions, operators, and constants that you can use in a formula, or expression, to calculate and return one or more values.
M Language
The language used in Power Query to define custom functions and data transformations.
Sensitivity Labels
Labels that can be applied to data to classify and protect sensitive data based on an organization’s policies.
Power BI Datamarts
A self-service analytics solution enabling users to store, explore, and manage data in a fully managed Azure SQL database.
Understanding the various components and features of Power BI is crucial for effectively leveraging its capabilities to drive data-driven decisions.

Categories
Data Engineering

Different approaches to ingest and transform data in a Medallion Architecture using Microsoft Fabric

Databricks introduced the medallion architecture, a method for organizing data within a lakehouse. In this post, I will compare the different approaches available in Microsoft Fabric for ingesting and transferring data using the Medallion architecture. The medallion architecture is a multi-hop system consisting of three layers: Bronze, Silver, and Gold. As data moves through these layers, it becomes cleaner and more refined. The objective of the medallion architecture is to structure and enhance the quality of data at each level, catering to various roles and functions.

Medallion Layers

The Medallion Layers can be organized using separate folders in a lakehouse or they can separate in independent lakehouses in the same workspace depending of the use case and maintenance capacities of the organization.

  1. Landing area

Before the data reaches the Bronze layer, it is gathered from various sources, including external vendors, in a temporary storage. Some of these sources might have file formats that are not suitable or structured for entry into the Bronze Layer. This storage can be implemented using Azure Data Lake Storage (ADLS) or Azure Blob Storage. The formats might include XML, JSON, CSV, etc.

  1. Bronze Layer

The Bronze layer represents the raw state of data sources, where both streaming and batch transactions are appended incrementally, serving as a comprehensive historical archive. For optimal storage in the bronze layer, it’s recommended to utilize columnar formats like Parquet or Delta. The beauty of columnar storage is in the way it organizes data by columns instead of rows. This arrangement not only offers enhanced compression possibilities but also streamlines the querying process, especially when working with specific data subsets.

For delta files bigger than 1TB, is recommended to divide the data in smaller partitions in order to improve performance and scalability following a folder structure year, month and day.

The data in the bronze layer is immutable or read-only and has minimal permissions on the files.

The Bronze data can be accessed by technical roles like platform engineers or data engineers. The Bronze layer might not be suitable for queries or ad-hoc analysis due to the raw nature of the data.

  1. Silver Layer

The Silver layer contains validated data that has been cleansed, standardized, and enriched; it is then merged, validated, deduplicated, and normalized to 3NF (Third Normal Form). Additionally, this data can be further transformed and structured using Data Vault Model, if your schema changes to often. The Silver layer store the files in delta format and they can be load to Delta Lake tables.

The Silver layer can provide data to many roles as Platform engineers, data engineers, data scientists, data analyst and Machine Learning engineers.

The permissions in this layer can provide read/write access.

  1. Gold Layer

The Gold layer serves as the foundation for the semantic layer, optimized for analytics and reporting. It features denormalized domain models, including facts and dimensions, conforming Kimball-style star schema, thereby forming a well-modeled data structure. The files are also store either in Delta format or Delta Lake Tables for reporting or analytics.

Data is highly governed and the permission are read only and granted at item or workspace level.

The data in the gold layer can be consumed by data Engineers, data scientist, data analyst and business analyst using tools like Power BI and Azure ML Services.

Fabric Tools

Microsoft Fabric offers a variety of tools for data ingestion and transformation, categorized into low-code and coded solutions:

No code/low code Tools:

Dataflow Gen 2, Copy Data Activity.

Coded Tools:

Fabric Notebooks, Apache Spark job definitions.

These tools can be orchestrated in a data pipeline using Data Factory.

  1. Dataflow Gen 2

Introduced in Power BI as Power Query-like interface, it is included in Fabric as a No code, low code tool for data preparation and transformation. Dataflows can be schedule to run individually or they can be called by a data pipeline. Dataflows support more than 150+ source connectors and 300+ transformation functions. Power Query offers easy-to-use visual operations, making common data transformations accessible to a broader audience. However, when diving deeper into custom operations within dataflows, the underlying M language used by Power Query can pose challenges due to its unique syntax and steep learning curve. Dataflow Gen2 operates using Fabric capacity, and you will be billed or charged for this capacity.

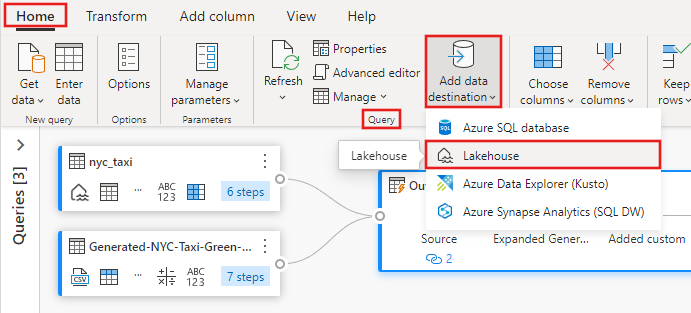
The screen show below shows a dataflow for ingestion to a lakehouse using the visual Power-Query facilities:

Screenshot showing the Add data destination button with Lakehouse highlighted.
  1. Copy Activity in Data Factory

The Copy Data Activity, which can be found in both Azure Data Factory and Azure Synapse Analytics, is a powerful tool designed for efficiently transferring and mildly transforming data across numerous data storage solutions. It serves as a primary component in several data workflows that necessitate the shifting and minimal transformation of data. To run the copy activity, you’ll need to establish an integration runtime. With support for over 30 source connectors, it’s especially suitable for data ingestion into the Bronze Layer where data comes in raw state and there is no need of transformations. Data movement activity pricing is about $0.25/DIU per hour. A DIU, or Data Integration Unit, represents the resources allocated for data movement activities in Azure.

Below is a screenshot illustrating a scenario where data is copied from ADSL Gen2 to the Bronze layer in the lakehouse.

  1. Data pipelines

A data pipeline groups activities logically. It can load data using the copy function or transform data by invoking notebooks, SQL scripts, stored procedures, or other transformation tasks. It’s highly scalable and supports workflow logic with minimal coding. It allows pass external parameters to identify resources, which is useful to run the pipelines in life cycle environments (development, testing, productions, etc). Data pipelines can run on-demand or scheduled based on time and frequency configurations.

Below is Data Factory pipeline calling another Synapse pipeline with a notebook activity.

New pipeline
  1. Fabric Notebooks

Notebooks are interactive web-based tools for developing Apache Spack jobs and machine learning experiments. They support multiple programming languages, allow mixing of code, markdown, and visualizations within a single document. Notebooks support four Apache Spark languages: PySpark (Python), Spark (Scala), SparkSQL and SparkR. Spark also provides hundreds of libraries to connect to data sources.

In PySpark, which is often utilized for distributed data processing, a DataFrame is the go-to tool for data loading and manipulation. It represents a dispersed set of data with named columns, akin to a table in a relational database or a dataframe in R or Python’s Pandas.

A notable application involves data validation when transitioning from the bronze to the silver layer. Libraries such as “Great Expectations” can be employed to authenticate data, ensuring consistency between the Silver and Bronze layers, as illustrated below.

import great_expectations as ge

# dfsales is already loaded as a PySpark DataFrame

# Convert Spark DataFrame to Great Expectations DataFrame
gedf = ge.dataset.SparkDFDataset(dfsales)

# Set up some expectations
# For demonstration purposes, let's set up the following expectations:
# 1. The "amount" column values should be between 0 and 1000.
# 2. The "date" column should not contain any null values.
# (You can set up more expectations as required.)

gedf.expect_column_values_to_be_between("amount", 0, 1000)
gedf.expect_column_values_to_not_be_null("date")

# Validate the DataFrame against expectations
results = gedf.validate()
print(results)

  1. Apache Spark job definition

The Apache Spark Job Definition streamlines the process of submitting either batch or streaming tasks to a Spark cluster, allowing for on-demand activation or scheduled execution. It accommodates the inclusion of compiled binary files, such as .jar files from Java or Scala, and interprets files like Python’s .py and R’s .R. Much like Spark Notebooks, Spark job definitions also support a vast array of libraries.

You can craft your data ingestion or transformation code in your preferred IDE (Integrated Development Environment) using languages such as Java, Scala, Python, or R. Developing Spark job definitions within an IDE offers comprehensive development features, integrated debugging tools, extensions, plugins, and built-in testing capabilities.

Below is a project on Data Quality Testing within the Medallion Architecture, leveraging Pytest and PySpark in Visual Studio Code.

  1. OneLake Shortcuts

Shortcuts act as reference points to other storage locations without directly copying or altering the data. They streamline operations, allowing notebooks and spark jobs to access externally referenced data without ingesting or copying it into the lakehouse. It’s possible to establish a shortcut in the Bronze layer without actually ingesting the data. Subsequently, this can be accessed via a notebook or a job definition using the OneLake API. While shortcuts are advantageous for handling small datasets or generating brief queries and reports, they might pose challenges for intensive transformations. Doing so could lead to substantial egress charges from third-party vendors or even from referenced ADLS accounts.

Shortcuts can be used as managed tables within Spark notebooks or Spark jobs.

df_bronze_products = spark.read.format("delta").load("Tables/bronze_products")
display(df_bronze_products)

df_bronze_sales = spark.sql("SELECT * FROM lakehouse.bronze_sales_shorcut LIMIT 1000")
display(df_bronze_sales)

Conclusion

Low-code and no-code solutions such as ADF Copy activity and Dataflow Gen 2 offer intuitive interfaces, allowing users to ingest and process data without extensive technical knowledge. Conversely, coding platforms like Fabric Notebooks or Spark job definitions empower users to craft bespoke and adaptable solutions harnessing programming languages. The optimal choice hinges on the specific requirements, the available skill set, and the organization’s willingness to take on technical debt. While ADF Copy activity and Dataflow Gen 2 might fall short in addressing intricate or tailored needs, coded platforms like Fabric Notebooks and Spark job definitions provide versatility to address complex custom scenarios. That said, managing extensive custom code can pose maintenance challenges. For more straightforward needs, any of these tools could be apt. Yet, in many situations, the most effective strategy might involve a hybrid approach, integrating the strengths of both paradigms.

When choosing a tool for data ingestion or transformation, it’s crucial to ensure consistency in its application. Employing the same tool throughout different layers promotes easier maintenance. Avoid mixing and matching or embedding various tools or components within each other. For example, when a dataflow, power query function, or notebook invokes stored procedures, it can lead to challenges in debugging and tangled dependencies. Ideally, Data Factory should be the main orchestrator, guiding all other processes, while limiting the interplay of multiple tools within a singular data pipeline.

References:

Call Synapse pipeline with a notebook activity

https://learn.microsoft.com/en-us/azure/data-factory/solution-template-synapse-notebook

Microsoft Fabric get started documentation

https://learn.microsoft.com/en-us/fabric/get-started/

What is a medallion architecture?

https://www.databricks.com/glossary/medallion-architecture
Categories
Alexa Artificial Intelligence

What’s next with Alexa

Speech recognition. The biggest challenge algorithms that can learn with small amount of data instead of huge amounts of data. Something in the human better in abstraction.

Speech recognition will be a commodity, no difference between Siri, Cortana, Alexa, Google Home, etc.


Alexa can recognize our voice.

Alexa and Screen give some value.

Categories
Deep Learning Machine Learning

Data Leakage in Time Series Data Cross-Validations in Machine Learning

While working on our research paper titled “High-frequency Trend Prediction of Bitcoin Exchange Rates Using Technical Indicators and Deep Learning Architectures”, we encountered numerous papers and specialized documentation that boasted an accuracy of over 90% for Trend Prediction for Bitcoin trading systems. However, upon closer examination, we found this accuracy to be relatively high in comparison to the performance of profitable and successful models that typically achieve about 60% accuracy. Further investigation revealed a persistent error that was responsible for this inflated accuracy: data leakage.

Time series data is a crucial component of many real-world applications, ranging from finance and economics to weather forecasting and predictive maintenance. Machine learning models trained on time series data require careful consideration to ensure accurate predictions. One critical aspect of building robust models is performing proper cross-validation. However, when handling time series data, there is a unique challenge called “data leakage” that can significantly impact the reliability and performance of these models. In this article, we will explore the concept of data leakage in time series data cross-validations in machine learning and discuss strategies to mitigate this issue.

Understanding Data Leakage:

Data leakage occurs when information from the future leaks into the past during the training and validation process of time series models. In other words, data that should not be available at the time of prediction becomes accessible during the training phase, leading to overly optimistic performance estimates and unreliable models.

Challenges in Time Series Cross-Validation:

Traditional cross-validation techniques like k-fold or stratified sampling are not directly applicable to time series data due to its temporal nature. When dealing with time series data, the order of observations matters, and predictions are made based on the historical context. Applying random shuffling or splitting can introduce severe leakage issues.

Strategies to Mitigate Data Leakage:

To address data leakage in time series data cross-validations, several techniques can be employed:

Train-Test Split:

Instead of using traditional k-fold cross-validation, a train-test split is commonly employed. The data is divided into a training set containing historical observations and a separate test set containing more recent observations. The model is trained on the training set, and performance is evaluated on the test set, providing a realistic assessment of its predictive abilities.

Rolling Window Validation:

In rolling window validation, the training and test sets are created by sliding a fixed-size window over the time series data. The model is trained on the past data within the window and evaluated on the subsequent data. This process is repeated until the end of the time series. This technique provides a more realistic evaluation of the model’s performance by simulating real-world scenarios.

Time-Based Validation:

In time-based validation, the data is split based on a specific time point. All data points before the chosen time point are used for training, while those after it are used for testing. This method ensures that future data is not accessible during training, preventing leakage.

Walk-Forward Validation:

Walk-forward validation extends the rolling window approach by performing iterative training and testing. The model is trained on the initial window, predictions are made for the next data point, and then the window is shifted forward. This process continues until the end of the time series. It allows the model to adapt and update its predictions as new data becomes available.

Conclusion:

When dealing with time series data in machine learning, it is essential to handle data leakage appropriately to build reliable and accurate models. By adopting strategies like train-test splits, rolling window validation, time-based validation, and walk-forward validation, we can mitigate the adverse effects of data leakage. Understanding the temporal nature of time series data and selecting appropriate validation techniques are crucial steps toward developing robust and trustworthy machine learning models in various domains.

Categories
Machine Learning

New Scikit-Learn visual cheat sheet

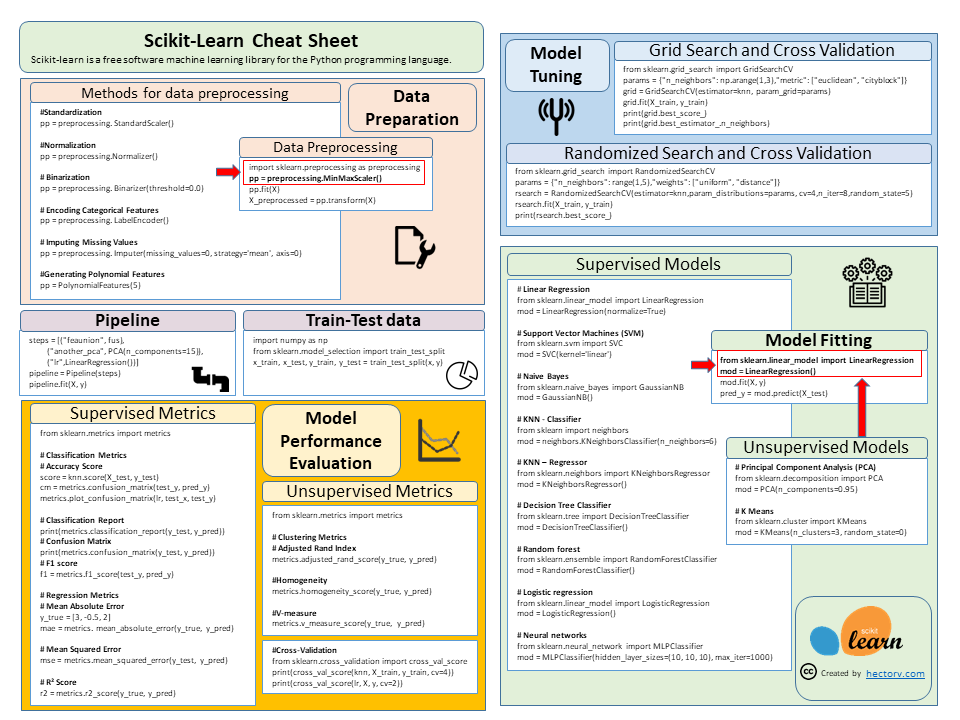
A simplified and visual Scikit-Learn summary highlights some key aspects used to implement machine learning solutions: data pre-processing, model fitting, model performance evaluation, model tuning. This guides shows the generalization used by this Python Library to use Data Preparation methods and Model fitting models in the same way and how they can be connected through the use of pipelines.  

http://hectorv.com/wp-content/uploads/sites/3/2021/12/scikit-learn-cheat-sheet.pdf

Categories
Datawarehouse Power BI

Análisis Estadístico del impacto de los Personeros en las elecciones presidenciales Peruanas de segunda vuelta Junio-2021

Reporte Interactivo: https://bit.ly/2SxBY4H

Por Hector Villafuerte, Julio 2021, https://twitter.com/hectorv_com

Resumen:

En las regiones excluyendo Lima, la distribución de votos para Fuerza Popular no es consistente en la población. Como lo muestra la siguiente figura, la distribución de votos para Fuerza Popular tiene una forma normal, cuando ambos personeros están presente durante el escrutinio. Pero cuando únicamente el personero de Perú Libre está presente en el escrutinio, la curva es extremadamente sesgada. Lo que no es consistente para la misma población. Esto muestra resultados diferentes en la votación cuando se segrega a las regiones usando la variable de personeros presentes durante el escrutinio. Este mismo patrón se repite en varios departamentos, cuando se segregan los resultados con la variable de personeros en cada departamento. El impacto de esta distorsión seria suficientemente grande a nivel nacional, como para reducir los resultados de los votos a favor de Fuerza Popular en más de 147,897 votos.

Figura Resumen: En Regiones sin Lima, la distribución de votos de Fuerza Popular no es consistente. Como lo muestra la siguiente figura, la distribución muestra forma normal cuando ambos personeros están presente (1), pero cuando únicamente el personero de Perú Libre está presente (2), la curva es extremadamente sesgada. Lo que no es consistente para la misma población regional, que muestra resultados diferentes cuando se segrega usando la variable de personeros presentes durante el escrutinio. El mismo patrón se muestra en detalle en varios departamentos. 

Introducción

En las elecciones presidenciales Peruanas de la segunda vuelta 2021, se puede visualizar que la distribución estadística de los votos de Fuerza Popular, muestra distorsiones con una distribución muy sesgada con un número alto de mesas con votación muy baja para Fuerza Popular.

La ubicación geográfica (departamento, provincia, distrito, local) sería la única variable que explicaría estas distorsiones como producto de un fenómeno regional, donde la votación de Fuerza Popular resulta en un alto número de mesas con muy bajas votaciones en favor de Fuerza Popular.

El análisis presentado en este documento incluye una nueva variable: la información de los personeros que participaron en el escrutinio.

Las actas de cada mesa contienen secciones donde firman los miembros de mesa y los personeros presentes durante la instalación, escrutinio y sufragio de cada mesa.

Para este análisis se procesó y contabilizó la data de personeros durante el escrutinio de más de 85,816 mesas, que son más del 99% del total de las mesas que se habilitaron en las elecciones. Se pueden determinar cuatro casos diferentes para cada mesa:

  1. Ambos personeros de Fuerza Popular y Perú Libre estuvieron presentes durante el escrutinio.
  2. Únicamente estuvo presente el personero de Fuerza Popular durante el escrutinio.
  3. Únicamente estuvo presente el personero de Perú Libre durante el escrutinio.
  4. Ningún personero estuvo presente durante el escrutinio.

Total de personeros

Esta información revela patrones en los datos que no pudieron ser identificados previamente con la data publicada por la ONPE.

En la figura 1, se puede ver que Perú Libre pudo cubrir más de 36,149 mesas con sus personeros, mientras Fuerza popular solo pudo cubrir alrededor de 29,235 mesas con sus personeros durante el escrutinio de los votos.

También se observa que el número de mesas donde únicamente estuvo el personero de Perú Libre y no estuvo el de Fuerza Popular, fueron alrededor de 11,210 mesas. El número de mesas donde solo estuvo el personero de Fuerza Popular y no estuvo presente el personero de Perú Libre, fueron 4,296 mesas, en otras palabras Perú Libre tuvo más del doble de mesas cubiertas únicamente por un personero de un partido.

Hubo cerca de 24,939 mesas a nivel nacional, donde ambos personeros, de Perú Libre y Fuerza Popular, estuvieron presentes durante el escrutinio. Y finalmente, hubo 45,398 mesas donde no estuvieron presentes ambos personeros.

Figura 1: Personeros Durante el escrutinio

Distribución Normal

La curva de campana, mostrada en la figura 2, es el tipo de distribución para una variable que se considerada normal o Gaussiana.

Figura 2: Curva Normal o de Gauss

Distribución de Votos a Nivel Nacional

A nivel nacional, la distribución total de los votos de Fuerza Popular no presenta una forma de curva de campana o curva normal, como se ve en la figura 3, mientras que la curva de distribución de votos de Perú Libre a nivel nacional, si presenta una forma de campana o forma de curva normal.

Figura 3: Distribución a nivel nacional de los votos en las mesas para las elecciones de segunda vuelta en Perú 2021. La curva de Fuerza Popular no es normal, mientras que la curva de Perú Libre si muestra una curva normal o gaussiana.

Lima versus Regiones sin Lima: Curva Normal versus curva Sesgada

En la Figura 4, se muestra la distribución de los votos de Fuerza Popular en Lima y en regiones sin Lima. Se puede identificar que en Lima y Callao la curva es normal, mientras que en Perú-sin Lima, la distribución de votos esta sesgada a la izquierda donde hay una cantidad grande de actas con votos muy bajos a favor de Fuerza Popular.

Figura 4: Comparación de la distribución de votos de Fuerza Popular en Lima/Callao versus las otras regiones del Perú sin Lima. La curva de Lima/Callao es definitivamente normal y la curva del Perú sin Lima presenta distorsiones.

Una explicación de este resultado propone que la población en ciertas regiones votó en forma diferente a Lima y esto resulto en una cantidad alta de mesas con votos muy bajos para Fuerza Popular.

Distribución en la región Lima es Normal

En la figura 5, se puede apreciar que en Lima la curva es normal para toda la región Lima/Callao y que seleccionando los casos donde los dos personeros estuvieron presentes, la curva también tiene una forma normal, lo que es consistente con la región geográfica de Lima y Callao.

Cuando ambos personeros están presente durante el escrutinio, el resultado de la votación es más fiable y exacta, ya que hay balances y chequeos de ambos personeros, razón por la que usamos este caso de personeros para poder comparar con los resultados totales en cada región.

Figura 5: LIMA/CALLAO: Comparación de la distribución de votos en Lima versus la distribución de votos en Lima con solo mesas donde ambos personeros están presentes durante el escrutinio. Las curvas son consistentes en la región, sin importar que los personeros de ambos partidos estuvieran presentes durante el escrutinio.

Conflicto en la Distribución en regiones fuera de Lima: curva es sesgada y normal en la misma región

El patrón de curva sesgada es el que se esperaría en las regiones de Perú-sin Lima. Si se selecciona solo las mesas en departamentos del Perú-sin Lima, donde ambos personeros están presentes, se esperaría obtener la misma curva este sesgada a la izquierda, para que sea consistente con el comportamiento de la población de la misma región geográfica.

En la figura 6, se comparan las distribuciones de votos de las mesas en regiones del Perú-sin Lima. En el lado izquierdo se muestra la curva de todas las mesas de votos de Fuerza Popular en Perú-sin Lima, en el cual se nota que esta curva esta sesgada hacia la izquierda. En el lado derecho de la figura, se ha seleccionado solo las mesas donde los dos personeros de los dos partidos estuvieron presente en las mesas de Perú-sin Lima. En este caso, la curva ya no está sesgada y se convierte en una curva normal, que es opuesto a resultado de las regiones que tienen una curva sesgada a la izquierda.

Figura 6: DEPARTAMENTOS EXCLUYE LIMA/CALLAO. Comparación de la distribución de votos en departamentos fuera de la capital versus la distribución de votos de la misma región con las mesas donde ambos personeros estuvieron presentes durante el escrutinio. Las curvas de votos de Fuerza Popular esta sesgada a la izquierda y cuando se seleccionan solo las mesas con ambos personeros presentes durante el escrutinio, la curva es peculiarmente normal. El comportamiento no es consistente en la región.

Las dos curvas de Fuerza Popular de la figura 6 no son consistentes con la ubicación geográfica de Perú-sin Lima, porque son diferentes dependiendo de la variable de personeros presentes durante el escrutinio.

En la figura 7, cuando se selecciona y compara con las mesas donde solo hubo personeros de Perú Libre se ve evidentemente un resultado muy diferente, para Perú-sin Lima. La curva extremadamente segada a la izquierda, que evidencia baja votación para Fuerza Popular.

Figura 7: Comparación de la distribución de votos en regiones sin Lima versus la distribución de votos en las mismas regiones sin Lima con solo las mesas donde solo estuvo el personero de Perú Libre presente durante el escrutinio. Los votos de Fuerza Popular están sesgados a la izquierda cuando solo está presente el personero de Perú Libre.

Distribución en los Departamentos

Teniendo un resultado no consistente en regiones fuera de Lima, donde la curva total es sesgada, pero es normal cuando los dos personeros están presentes, el siguiente paso es comparar las mismas curvas a nivel de departamento.

En la figura 8, se puede observar las curvas a nivel de cada departamento y en especial en los departamentos que se señalan con un recuadro rojo: Cusco, Cajamarca, Puno y otros muestra un sesgo pronunciado a la izquierda.

Figura 8: Distribución de votos de Fuerza Popular de cada departamento. Muestra varios departamentos con curvas sesgadas a la izquierda.

En la figura 9, cuando se selecciona solo las mesas donde están presentes ambos personeros, las curvas tienden a ser normales, tal como se ve en el agregado de las regiones. Note la diferencia de los departamentos de Cajamarca, Cusco y Puno con formal normal con la de la figura 8, donde los mismos departamentos muestran una curva de votos sesgadas.

Figura 9: Distribución de votos de Fuerza Popular de cada departamento con mesas donde estuvieron presentes ambos personeros de Fuerza Popular y Perú Libre durante el escrutinio. Las curvas no están sesgadas a la izquierda, las curvas muestran un patrón de curva normal.

Y por último, en la figura 10, cuando se seleccionan solo las mesas donde Perú Libre tuvo un personero y Fuerza Popular no estuvo presente, las curvas se distorsionan notablemente hacia la izquierda que muestra una cantidad elevada de votos bajos para fuerza popular.

Figura 10: Distribución de votos de Fuerza Popular de cada departamento con mesas donde estuvieron presentes solo personeros de Perú Libre durante el escrutinio. Las curvas muestran un sesgo muy amplio hacia la izquierda.

Caso cuando no hay personeros en la mesa

El caso cuando no hay personeros de ningún partido en la mesa durante el escrutinio debería ser examinado con cuidado. En el entrenamiento a personeros de Perú Libre se recomendó a sus seguidores a ser miembros de las mesas donde les tocaba sufragar, tal como lo dice en el documento de entrenamiento de Perú Libre en la Figura 11.

Si este fuera el caso, el impacto de las distorsiones incluiría también los casos donde no hubo personeros durante el escrutinio de las mesas, pero podría haber influencia escondida de seguidores de Perú Libre como miembros de mesa, sin personeros en mesa.

Figura 11: Documento Oficial de capacitación de personeros de Perú Libre.

Publicado en Abril de 2021 en la página web oficial de Perú Libre:

http://perulibre.pe/wp-content/uploads/2021/04/capacitacion-personeros.pdf

Impacto en los resultados finales

El impacto de los personeros fue muy determinante en las elecciones de segunda vuelta en número total de votos. En la figura 12, se puede ver el resultado de la simulación de un escenario donde se cuentan las mesas que tuvieron dos personeros de ambos partidos: Perú Libre y Fuerza Popular o ningún personero en mesa, eliminando las mesas donde solo un personero de un partido está presente. Fuerza Popular obtiene una ventaja de 103,657 votos. Lo que resulta en una diferencia de más de 147,897 votos si se agrega la diferencia de 44,240 votos a favor de Perú Libre. Esto demuestra que el factor personeros es importante y determinante para el resultado final de las elecciones a nivel nacional.

Figura 12: Escenario donde se eliminan las mesas donde personeros de Perú Libre estuvieron únicamente en la mesa y se eliminan las mesas donde los personeros de Fuerza Popular estuvieron únicamente en la mesa.

Conclusion

Con esta nueva información se abren preguntas acerca de las regiones sin incluir Lima/Callao:

¿Por qué los votos a favor de Fuerza Popular no son consistentes dentro de cada región?

¿Por qué las curvas son diferentes cuando se comparan los votos en los casos que hay dos personeros presentes versus cuando únicamente está el personero de Perú Libre presente dentro de cada región?

La curva de votos a favor de Fuerza Popular es sesgada en algunas regiones. Pero la curva no es sesgada cuando se toma en cuenta mesas donde ambos personeros están presentes durante el escrutinio en la misma región.

Cual otra variable, fuera de la de personeros, podría explicar este patrón irregular de resultados de las votaciones cuando esta el personero de Perú Libre?

Estos datos encontrados, rechazarían la hipótesis que la distribución de los votos de Fuerza Popular en regiones al interior del país esta sesgada debida solo a que la población en estas regiones tiene un patrón de votación diferente. Este análisis de los datos de los personeros, evidencia resultados en la votación diferente o inconsistente para la misma población regional, cuando ambos personeros están presentes y cuando solo el personero de Perú Libre está presente. Los resultados de la votación no son consistentes para el mismo departamento o en la misma región. Dependiendo del caso de personeros presentes, la curva es sesgada y en el otro caso la curva es normal.

La variable de personeros durante escrutinio explica este sesgado mejor que la variable geográfica y es finalmente la que determina el resultado final de los votos de Fuerza Popular. Estas distorsiones o sesgado a nivel regional se agregan y resultan en distorsiones a nivel nacional.

Como se muestra en el análisis de escenarios, estas distorsiones tienen un impacto determinante en el resultado final se las elecciones. Lo que resultaría, en caso de eliminar casos de mesas con personeros únicos de ambos partidos, en una ventaja a favor de fuerza popular de 103,657 votos.

Por esto hace necesario hacer una investigación más amplia, tomando en cuenta los casos expuestos para determinar la validez de los resultados.
Categories
Artificial Intelligence Azure C# No SQL

Adding handwritten data from PDF files to a dataset

The following is a flow that show the sequence and tools used to extract information from a public PDF file with hand written information to text. Two critical steps are OCR ( Optical character recognition ) text extraction using Azure Computer Vision API service and KUTools which is an Excel add-in that allow to visualize images from the cloud in an row excel style to validate the accuracy of the OCR.

The process took few hours after running multiple processes to get different ranges of data.

The process successfully detect the correct information in more than 99% of the cases.

Categories
Datawarehouse Power BI

What-If Analysis for 2021 Peruvian Presidential Elections

The Interactive report was published here:  https://bit.ly/2SxBY4H

The following is an overview series of data analysis using different tools of the data resulting from the latest 2021 Peruvian Presidential Elections. The Left-wing candidate Pedro Castillo, received 50.125% against 49.875% for the Right-wing candidate, Keiko Fujimori.

The “Fuerza Popular” party’s candidate, Keiko Fujimori, is calling for an audit after alleging “grave irregularities”.

Many of these irregularities are being challenged and resolved by electoral authorities that can lead to having votes annulled in the polling stations.

In this analysis, we try to point out the magnitude or impact of some irregularities and figure out if these cases are isolated or if they are significant in number of votes that could affect the final outcome.

The Dataset

Two datasets were published by Peruvian official authorities corresponding to first and second round of the elections.

Resultados por mesa de las Elecciones Presidenciales 2021 Primera Vuelta – [Oficina Nacional de Procesos Electorales (ONPE)

https://www.datosabiertos.gob.pe/dataset/resultados-por-mesa-de-las-elecciones-presidenciales-2021-primera-vuelta-oficina-nacional-de

Resultados por mesa de las Elecciones Presidenciales 2021 Segunda Vuelta – [Oficina Nacional de Procesos Electorales (ONPE)

https://www.datosabiertos.gob.pe/dataset/resultados-por-mesa-de-las-elecciones-presidenciales-2021-segunda-vuelta-oficina-nacional-de

The first round participated “Fuerza Popular” and “Peru Libre” among other 16 parties from right, center and left wing.

The most granular level of data in these datasets are called “mesas” or “actas”, which are the pooling stations where the votes are record. Each “acta” has a maximum of 300 people registered to vote.

It is very important to familiarize with the dataset before any analysis. There are some records that should not be part of the counting because they are null out already by Electoral Peruvian Authorities as the ones with “ESTADO ACTA” field where the value “ANULADA”, which means that the record has been null out with zeroes due to irregularities.

Atypical Results in Pooling Stations covered by these Scenarios

Under Peruvian law, if the irregularity of an “acta” is demonstrated, the electoral authority should null the “acta” and all the votes would zero out for both candidates.

The scenarios are described in detail within the report. While we have specified five different scenarios, there may be more scenarios that can lead the same results.

Each scenario shows an atypical or peculiar pattern that once is detected, then is removed from the counting for both parties to have fair effect across the voting which affect both candidates using the same criteria.

Some scenarios test the variances between votes in the first round and the second round and qualify as peculiar some extreme cases where the vote of one party reduces dramatically when compare to the voted from the first round. Other scenarios use number of votes resulting in the pool goes to zero or one.

These scenarios can be tuned using parameters live votes, variation of votes and variation of votes in percentages.

The result of each scenario is shown in the chart, where we can see the impact of the exclusion of votes in both parties.

We can drill through details at the locality level, where we can observe the “mesas” excluded from the counting due to anomaly filter out by the scenario.

We can see the detail at the “mesa” or “acta” level. In the sample below we can see the distortion of votes in one single “acta”. All right wing votes obtained in the first round disappeared in the second round.

Tools

Tools used are MS SQL Server and Python for data processing and Power BI for data analysis.

Next

In some following articles we’ll use other techniques used in election forensics try to determine if the results are statistically normal or statistically abnormal:

  • Testing the correlation between vote share of a party and turnout.
  • Checking if the votes received by a candidate obey Benfords’s law
  • Checking for disproportionate presence of 0s in the “actas”.
  • Deviation from statistical laws observed in election data.
  • Using machine learning algorithms to detect anomalies.
Categories
Artificial Intelligence Machine Learning Power BI

Automated Machine Learning (AutoML) in Power BI

Automated Machine Learning (AutoML) in Power BI presentation by Hector Villafuerte at the SQL Saturday  – February South Florida 2020 and South Florida Code Camp in Davie.

AutoML was proposed as an artificial intelligence-based solution to the ever-growing challenge of applying machine learning. Business analysts can build Machine Learning models to solve business problems that once required data scientists. In this session, Hector will explain the principles of Machine Learning and AutoML (Automated machine learning) and he will demo AutoML PowerBI features end-to-end and show How to interpret and extract the optimum results based on specific business problems.


Bitnami