Note: This article was updated with a new formatting feature released. See the updated version of this article:
http://hectorv.com/table-or-matrix-for-side-by-side-column-comparison-with-columns-with-different-formats-in-the-same-column-updated
Note: As of now, April 2017, Power BI does not support different formats for the same column in a Table or a Matrix. This article shows a work around to achieve different formats for the same column. This work around can be applied to a Table or to a Matrix Report Visual.
You can download this Power BI desktop file from this link: https://1drv.ms/u/s!AjlEiXFjD5fu2SehP8jKkcpwJacf
There are many cases where we need to use a table or a matrix and we need to specify different formats in the same column. Showing the format with the numeric values makes the report easier to read than a simple number with no units.
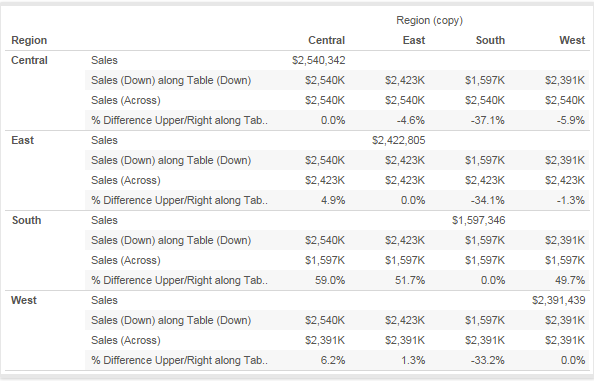
In the case of this financial report below, we can see three different formats in the same column:
Currency ($), Currency and Thousand ($K), and Percent (%).
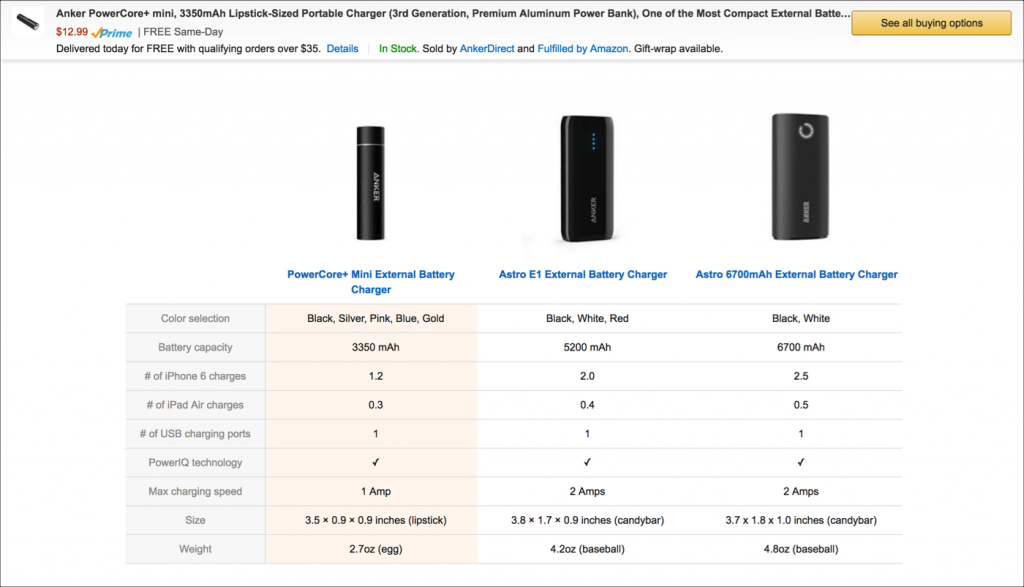
Another example is a side by side comparison of products. In the case below, we have different formats like: text, mAh, decimal number, Whole number and Amp formats, all of them in the same column.
I’ll show you this solution based on financial sample data downloaded from:
https://powerbi.microsoft.com/en-us/documentation/powerbi-sample-download-the-financial-sample-workbook/
This spreadsheet will be imported using Power BI desktop and you have to choose the worksheet: financial. Notice that this solution works for both: Power BI imported mode and live connection mode to SSAS Tabular. In the case of SSAS Tabular, you would have to import the excel spreadsheet in the Visual Studio Project.
I created a flag URL for the image, which is not part of the objective for this article. Even though, I’ll show you the calculated column formula created in the Financial Table:
Flag = "https://image.ibb.co/" & SWITCH([Country],"France","d4vwba/fr.png","Mexico","h8uHhF/mx.png","Germany","nGmV2F/de.png","Canada","dsjuUv/ca.png","United States of America","c023NF/us.png")
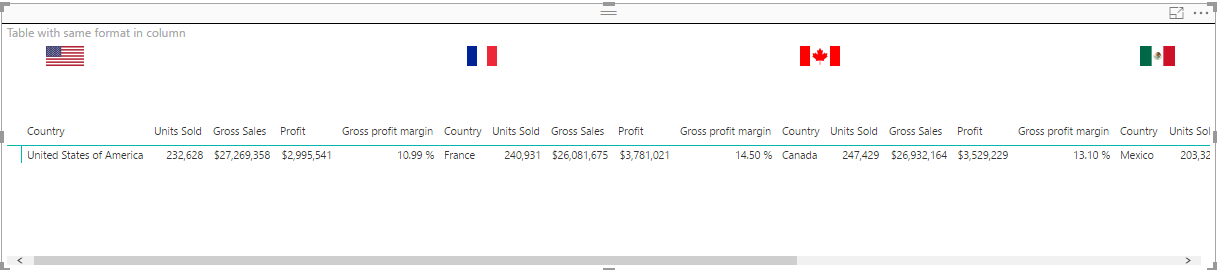
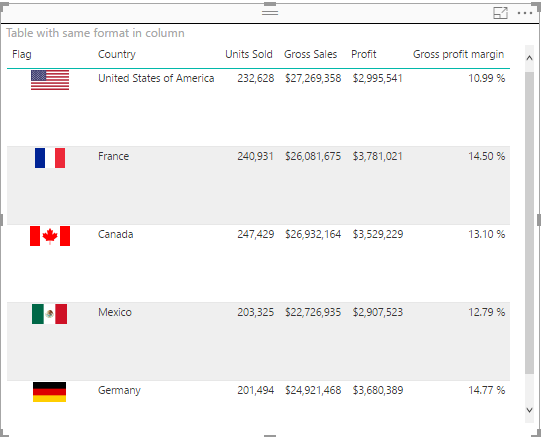
The following table was easy to create. Each country has a row and we can do a row by row comparison.
Even though, this is not what we are looking for. We are trying to get a side by side column comparison having all country fields in one column. We can create a matrix moving the fields to the matrix sections: Column, Rows and Values as shown below:.
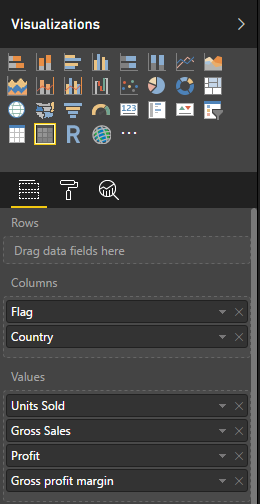
This is the Matrix Report version, after changing the flag and Country fields to the Column section in the Matrix. All fields under the configured Values section are shown as separate columns.
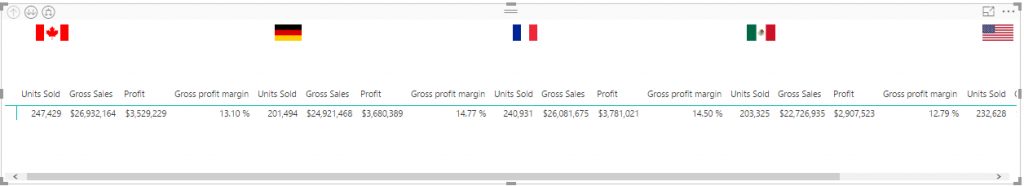
What I really want is only one column per country and also the columns header in the left side of the table as the very first column.

There are few challenges we have to overcome here:
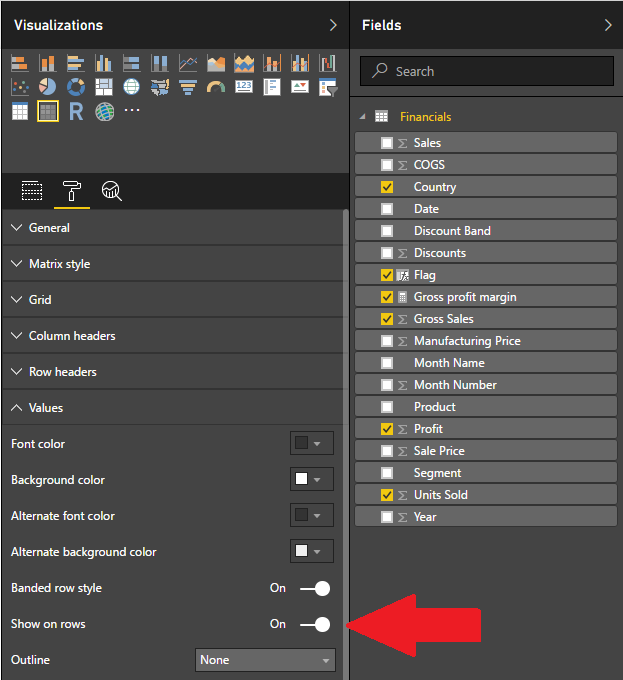
- In Power BI, the visual table and matrix do not support custom value formatting on rows. We have different formats in the same column for the report we are trying to create:
- The Flag field has Image URL format.
- The Country field has Text format.
- The Unit Sold field has a Whole Number format.
- The Gross Sales and Profit field have Currency format.
- The Gross Profit Margin field has Percentage format.
- The order should be specific and we should have control over it. Meaning, if I need a different order in the rows, I should able to change it.
The Solution
This are the steps we need to create a comparison report with only one column per country,
- I need to create a ReportTable in Power Query. If you are using import mode in Power BI Desktop, you can use the Enter Data option in Power Query.
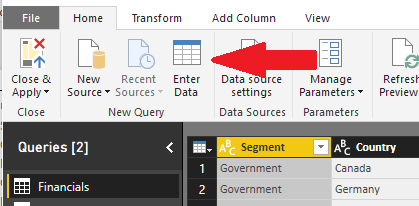
This ReportTable holds the structure, order and description of every row in the report, we do not include the Flag field, since we’ll use this field as report header.

If you are using Tabular SSAS with live connection, you can create the report table in your model by importing this from Excel or from a SQL Server database or you can also create the table with DAX using the following:
select 1 as [Index], 'Country' as [Description]

union all

select 2 as [Index], 'Units Sold' as [Description]

union all

select 3 as [Index], 'Gross Sales' as [Description]

union all

select 4 as [Index], 'Profit' as [Description]

union all

select 5 as [Index], 'Gross Profit Margin' as [Description]
Now, this is the trick: we need to create a Measures that will change dynamically based on the context of the row and it will calculate the corresponding measure with the correct format.
This measure will be created in the ReportTable.
ComparisonMeasure =

SWITCH(MAX(ReportTable[Index]),

1,

FIRSTNONBLANK(financials[Country],1),

2,

FORMAT(SUM(financials[Units Sold]),"###,###,###" ),

3,

FORMAT(SUM(financials[Gross Sales]),"$###,###,###"),

4,

FORMAT(SUM(financials[Profit]), "Currency"),

5,

FORMAT([Gross profit margin], "Percent"))
Then, we’ll use ReportTable[ComparisonMeasure] measure in the Values section of the Matrix. The Rows section will have the ReportTable[Description] field. Last, we’ll use the Financial[Flag] calculated column in the Columns section, as shown below.

This is how the report looks like now:
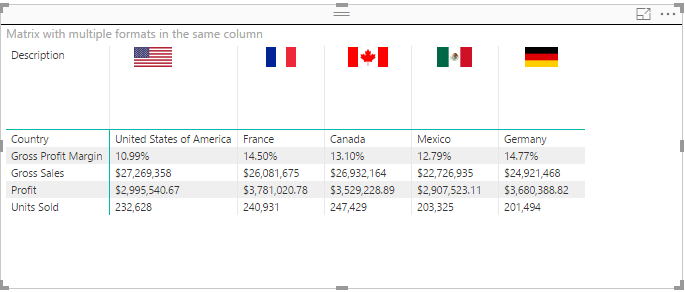
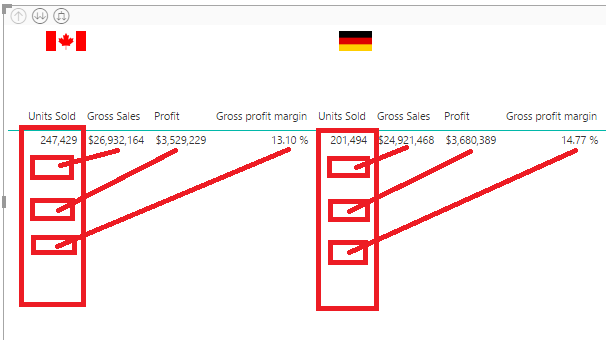
The table looks good. Side by side comparison with different formats in the columns was achieved! But there are still two issues with this Report.
- All the values are aligned to the left and Power BI does not have a feature to align column or cells in Tables nor in Matrices. The values in the columns are all text now, aligned to the left by default, so we need to align the currency, number and percentages to the right.
- Also, the order of the Matrix is alphabetically by ReportTable[Description].
Solution:
In order to fix the alignment, we’ll change the measure again and add empty spaces to force alignment to the right. This kind of alignment workaround is not pixel perfect, but we need to do this way until Power BI release a new alignment feature for table or matrix reports.
ComparisonMeasure =

VAR GrossSales=FORMAT(SUM(Financials[Gross Sales]),"$###,###,###")

VAR GrossSalesAligned=CONCATENATE(REPT(" ",20-LEN(GrossSales)),GrossSales)

VAR UnitsSold=FORMAT(SUM(Financials[Units Sold]),"###,###,###" )

VAR UnitsSoldAligned=CONCATENATE(REPT(" ",22-LEN(UnitsSold)),UnitsSold)

VAR Profit=FORMAT(SUM(Financials[Profit]), "$###,###,###")

VAR ProfitAligned=CONCATENATE(REPT(" ",20-LEN(Profit)),Profit)

VAR GrossProfitMargin=FORMAT([Gross profit margin], "Percent")

VAR GrossProfitMarginAligned=CONCATENATE(REPT(" ",23-LEN(GrossProfitMargin)),GrossProfitMargin)

RETURN

SWITCH(MAX(ReportTable[Index]),

1,

CONCATENATE(REPT(" ",4),FIRSTNONBLANK(Financials[Country],1)),

2,

UnitsSoldAligned,

3,

GrossSalesAligned,

4,

ProfitAligned,

5,

GrossProfitMarginAligned

)
After this change the Report looks better aligned.

Now in order to solve the order issue, we verify that the ReportTable[Index] field is selected as default in “Sort by Column” option.

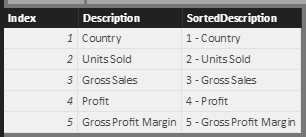
Even though, after this the Matrix is still sorting by Description and not by Index. Then, I’ll create a calculated column in ReportTable, to concatenate the Index and Description in only one column:
SortedDescription = [Index] & " - " & [Description]
Now, the ReporTable shows the new column:
When SortedDescription replaces Description in the Rows section, the Matrix displays the correct sorting.

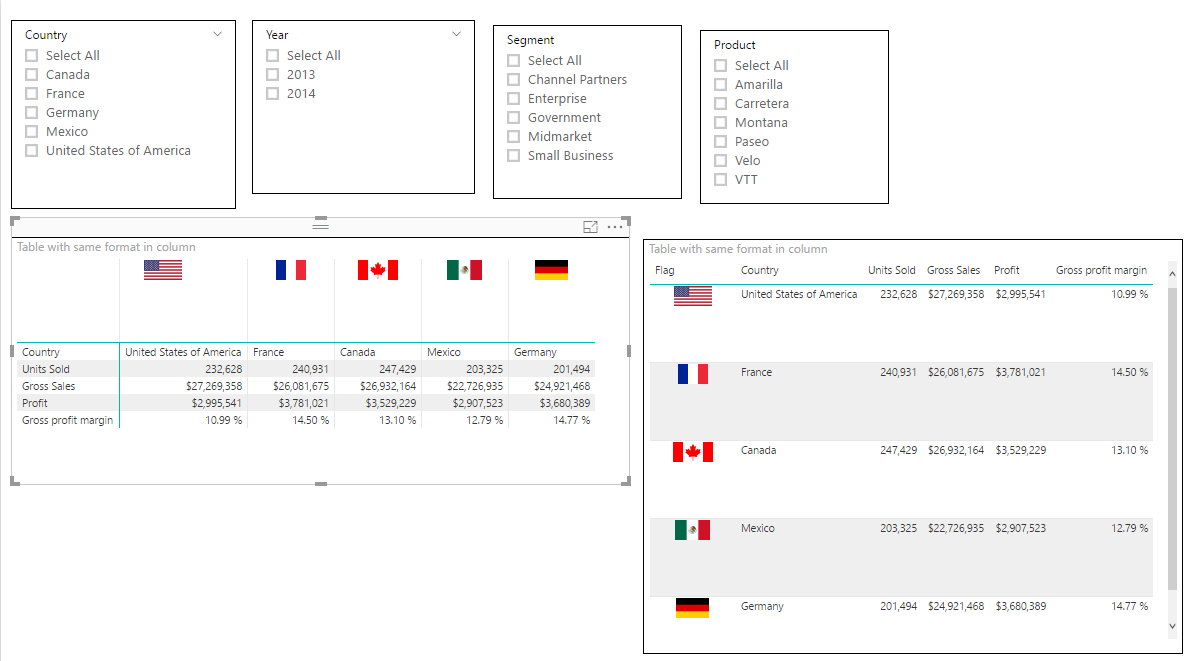
We add some slicers and we have both versions side by side matrix and simple table.

There is extra effort to create this kind of report in PowerBI. Even though, there are some cases where the side by side comparison in column and the formatted values are much easier to read than table with rows by row comparison. Especially, when there are multiple items or rows, it is easier for the end-user to compare columns side by side, where you can scroll up and down rather than scroll the table horizontally in a row by row comparison.
You can download this Power BI desktop file with this link: https://1drv.ms/u/s!AjlEiXFjD5fu2SehP8jKkcpwJacf