
Understanding the complexities of Power BI might occasionally seem like threading through a labyrinth, considering its rich architecture, diverse components, and plethora of features. I’m delighted to present this unique Power BI diagram, which condenses all these facets into a simple, visual representation.
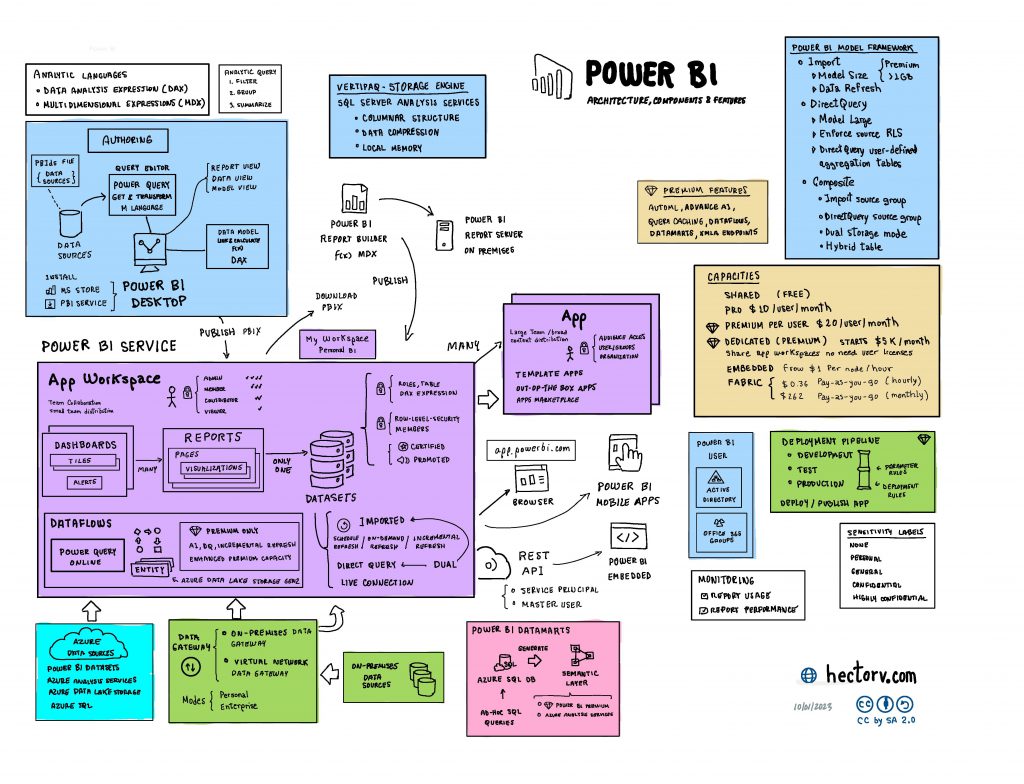
Below is a concise definition for each of these components:
| Power BI Desktop A free application installed on your local computer that lets you connect to, transform, and visualize your data. |
| Power BI Service A cloud-based service (also referred to as Power BI online) where you can share and collaborate on reports and dashboards. |
| Power BI Mobile A mobile application available on iOS, Android, and Windows that lets you access your Power BI reports and dashboards on the go. |
| Power BI Gateway Software that allows you to connect to your on-premises data sources from Power BI, PowerApps, Flow, and Azure Logic Apps. |
| Power BI Embedded A set of APIs and controls that allow developers to embed Power BI visuals into their applications. |
| Power BI Premium An enhanced version of Power BI that offers additional features, dedicated cloud resources, and advanced administration. |
| Power BI Pro A subscription service that offers more features than the free version, like more storage and priority support. |
| App Workspace A collaborative space within Power BI where teams can work together on dashboards, reports, and other content, as well as manage workspace settings. |
| App A Power BI content package including dashboards, reports, datasets, and dataflows, shared with others in the Power BI service. |
| Dashboard A single canvas that displays multiple visualizations, offering a consolidated view usually across numerous datasets. |
| Report A multi-perspective view into a dataset, created with a Power BI Desktop and published to the Power BI service. |
| Paginated Report Detailed, printable reports with a fixed-layout format, optimized for printing or PDF generation. |
| Power BI Dataset A collection of related data that you bring into Power BI to create reports and dashboards. |
| Power Query A data connection technology that enables you to discover, connect, combine, and refine data across a wide variety of sources. |
| Dataflows A cloud-based data collection and transformation process that refreshes data into a common data model for further analysis. |
| Imported Mode A data connection mode in Power BI where data is imported into Power BI’s memory, allowing for enhanced performance at the cost of real-time data refresh. |
| Direct Query Mode A data connection mode in Power BI where queries are sent directly to the source data, allowing for real-time data analysis. |
| DAX (Data Analysis Expressions) A collection of functions, operators, and constants that you can use in a formula, or expression, to calculate and return one or more values. |
| M Language The language used in Power Query to define custom functions and data transformations. |
| Sensitivity Labels Labels that can be applied to data to classify and protect sensitive data based on an organization’s policies. |
| Power BI Datamarts A self-service analytics solution enabling users to store, explore, and manage data in a fully managed Azure SQL database. |
| Understanding the various components and features of Power BI is crucial for effectively leveraging its capabilities to drive data-driven decisions. |