
The Interactive report was published here: https://bit.ly/2SxBY4H
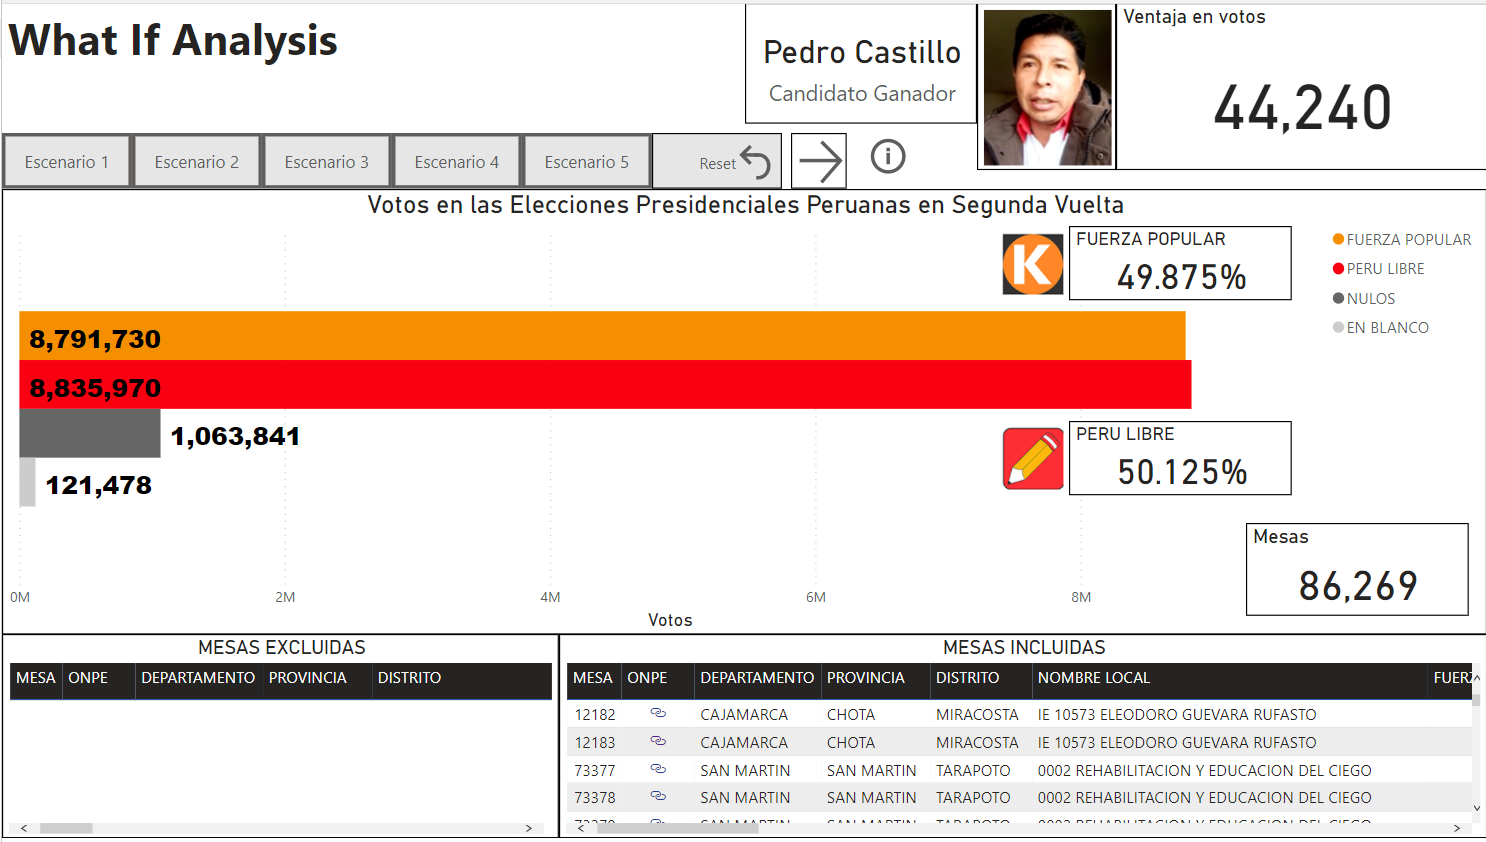
The following is an overview series of data analysis using different tools of the data resulting from the latest 2021 Peruvian Presidential Elections. The Left-wing candidate Pedro Castillo, received 50.125% against 49.875% for the Right-wing candidate, Keiko Fujimori.
The “Fuerza Popular” party’s candidate, Keiko Fujimori, is calling for an audit after alleging “grave irregularities”.
Many of these irregularities are being challenged and resolved by electoral authorities that can lead to having votes annulled in the polling stations.
In this analysis, we try to point out the magnitude or impact of some irregularities and figure out if these cases are isolated or if they are significant in number of votes that could affect the final outcome.
The Dataset
Two datasets were published by Peruvian official authorities corresponding to first and second round of the elections.
Resultados por mesa de las Elecciones Presidenciales 2021 Primera Vuelta – [Oficina Nacional de Procesos Electorales (ONPE)
Resultados por mesa de las Elecciones Presidenciales 2021 Segunda Vuelta – [Oficina Nacional de Procesos Electorales (ONPE)
The first round participated “Fuerza Popular” and “Peru Libre” among other 16 parties from right, center and left wing.
The most granular level of data in these datasets are called “mesas” or “actas”, which are the pooling stations where the votes are record. Each “acta” has a maximum of 300 people registered to vote.
It is very important to familiarize with the dataset before any analysis. There are some records that should not be part of the counting because they are null out already by Electoral Peruvian Authorities as the ones with “ESTADO ACTA” field where the value “ANULADA”, which means that the record has been null out with zeroes due to irregularities.
Atypical Results in Pooling Stations covered by these Scenarios
Under Peruvian law, if the irregularity of an “acta” is demonstrated, the electoral authority should null the “acta” and all the votes would zero out for both candidates.
The scenarios are described in detail within the report. While we have specified five different scenarios, there may be more scenarios that can lead the same results.
Each scenario shows an atypical or peculiar pattern that once is detected, then is removed from the counting for both parties to have fair effect across the voting which affect both candidates using the same criteria.
Some scenarios test the variances between votes in the first round and the second round and qualify as peculiar some extreme cases where the vote of one party reduces dramatically when compare to the voted from the first round. Other scenarios use number of votes resulting in the pool goes to zero or one.
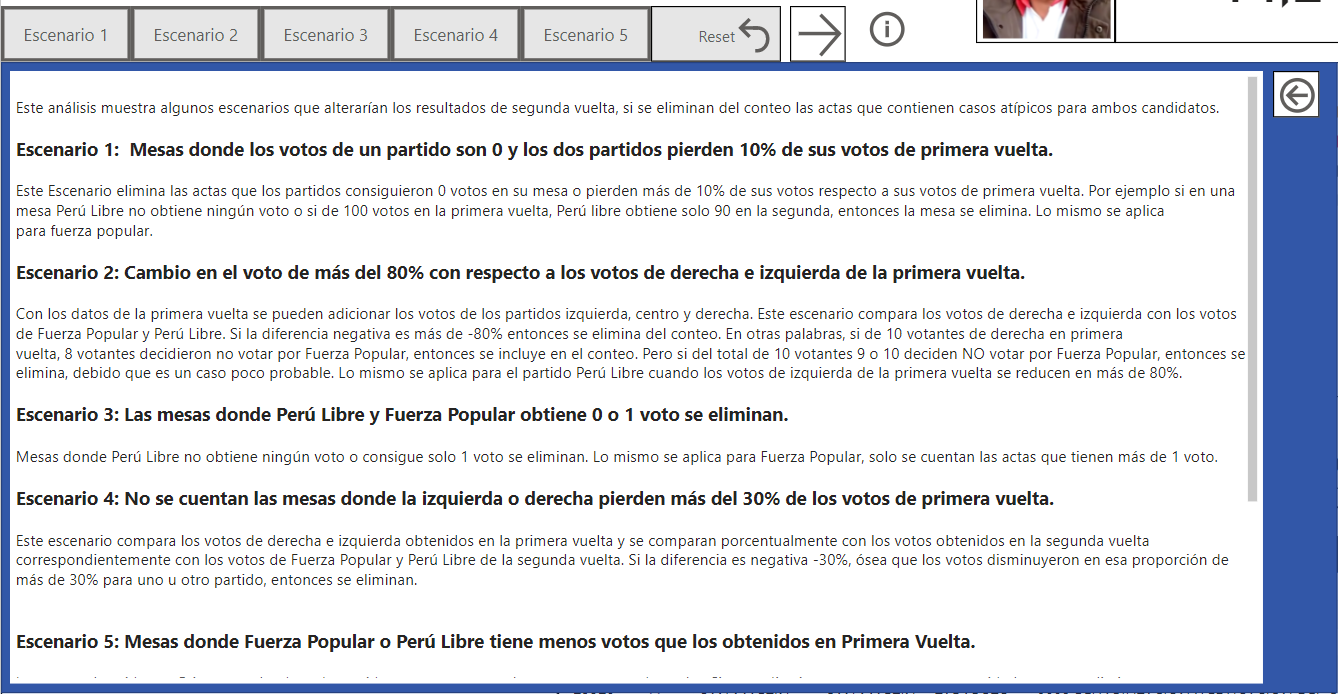
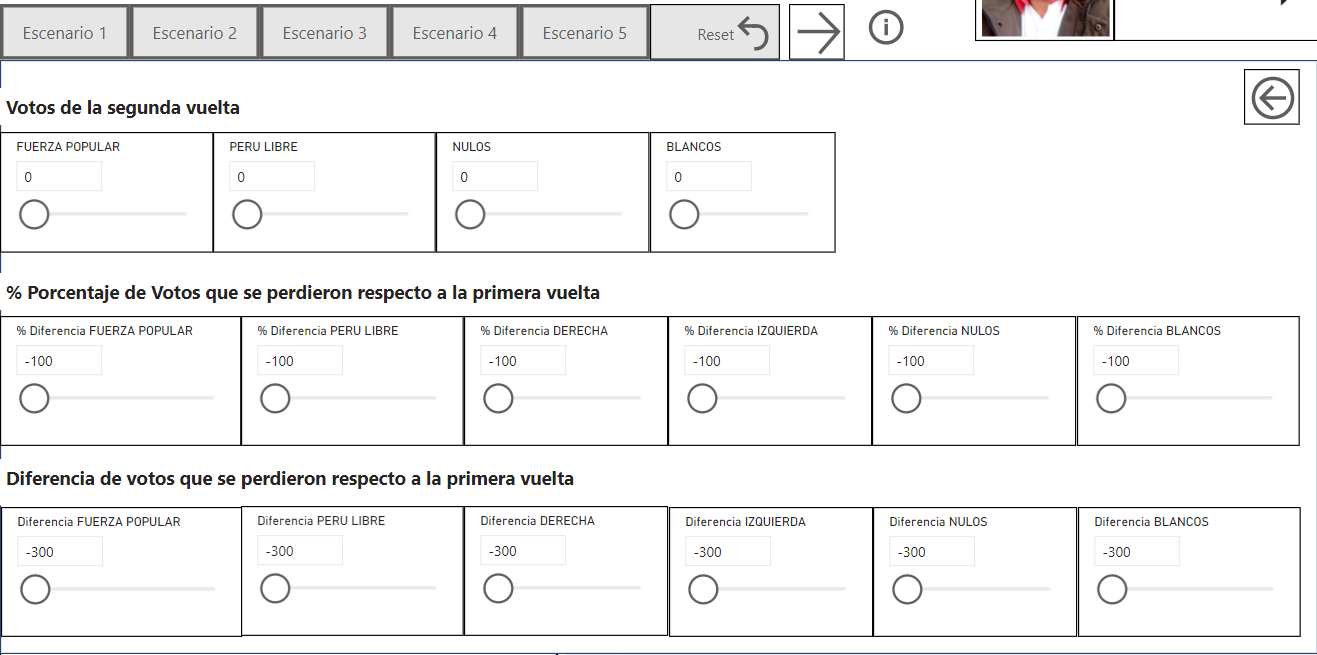
These scenarios can be tuned using parameters live votes, variation of votes and variation of votes in percentages.
The result of each scenario is shown in the chart, where we can see the impact of the exclusion of votes in both parties.
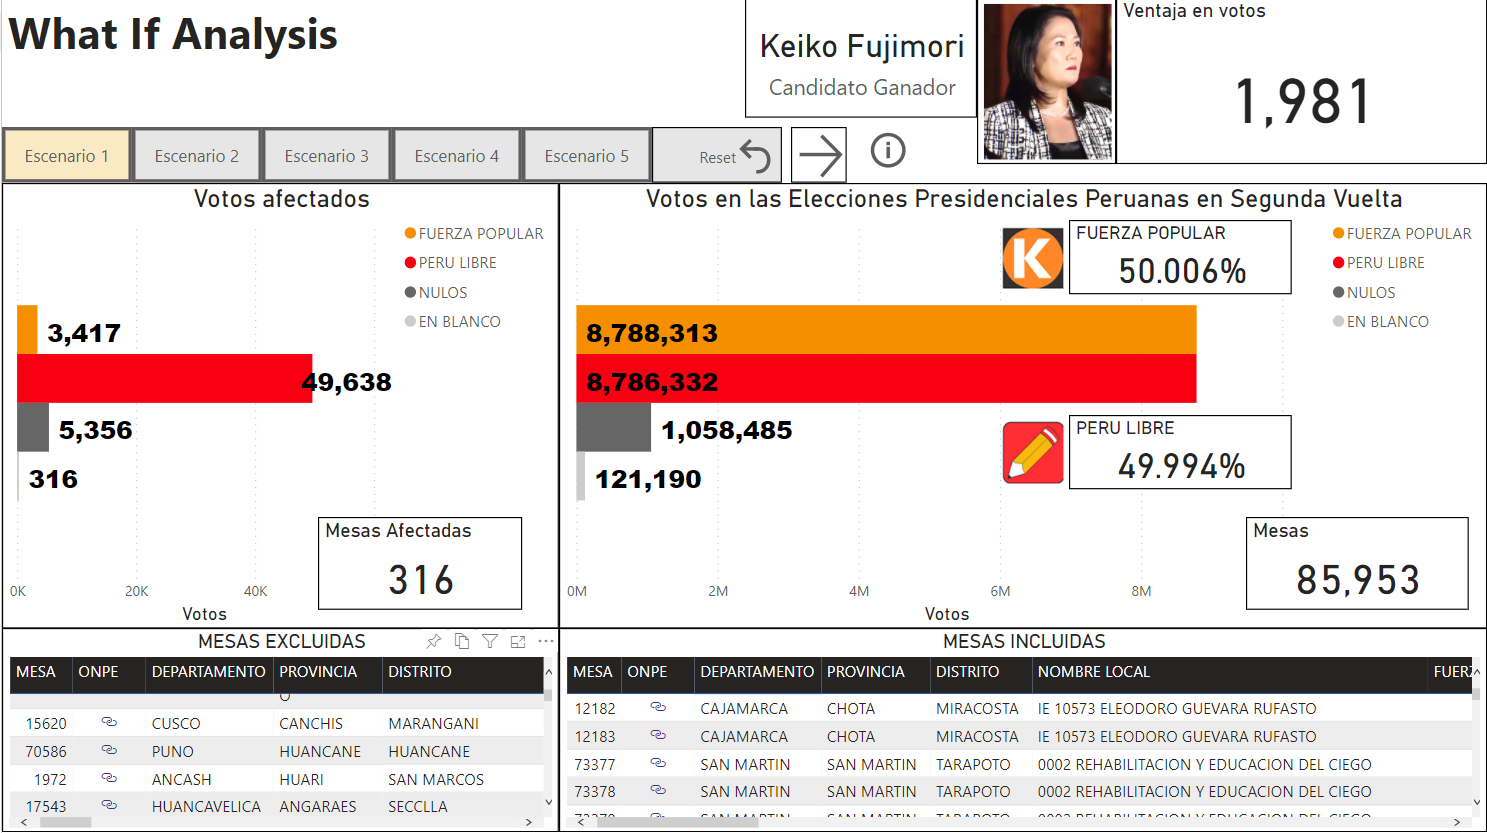
We can drill through details at the locality level, where we can observe the “mesas” excluded from the counting due to anomaly filter out by the scenario.
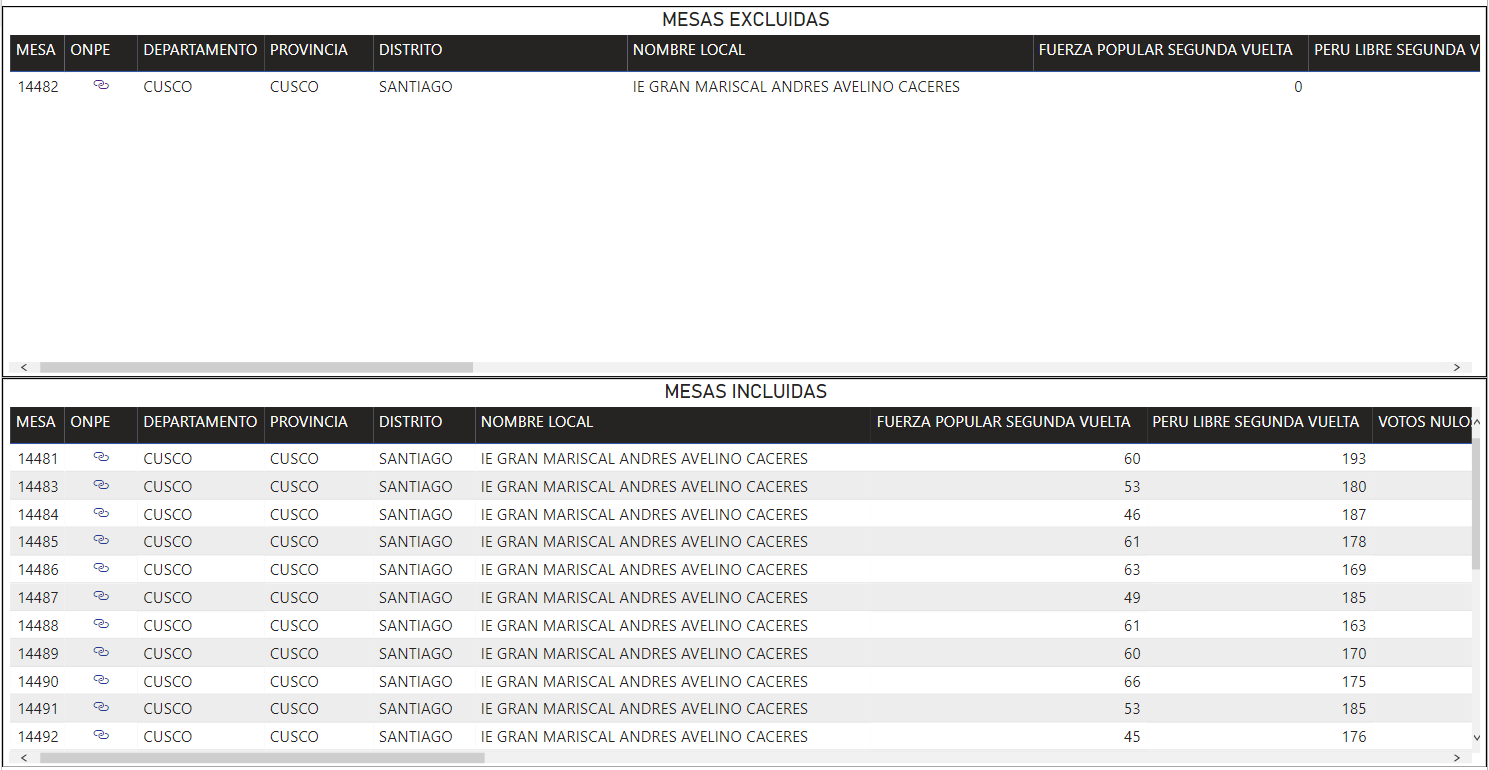
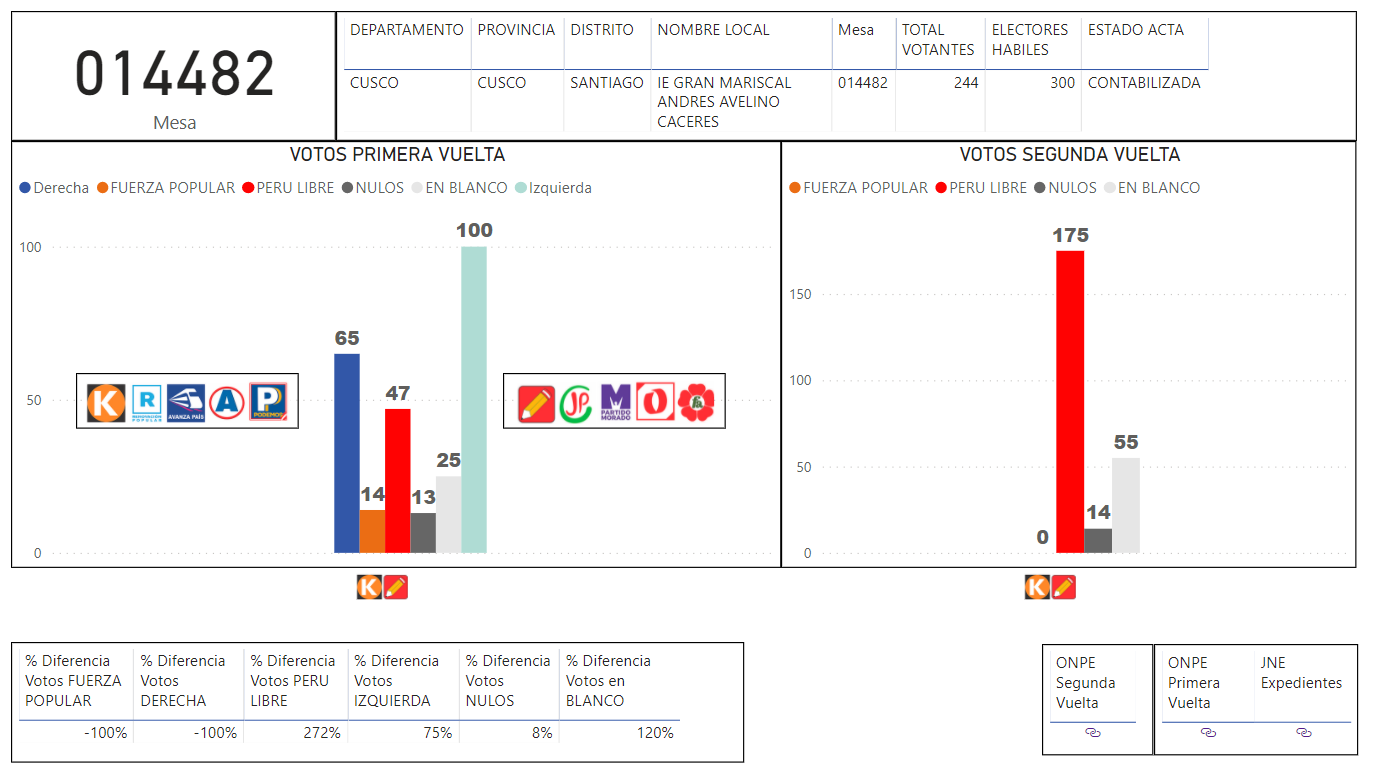
We can see the detail at the “mesa” or “acta” level. In the sample below we can see the distortion of votes in one single “acta”. All right wing votes obtained in the first round disappeared in the second round.
Tools
Tools used are MS SQL Server and Python for data processing and Power BI for data analysis.
Next
In some following articles we’ll use other techniques used in election forensics try to determine if the results are statistically normal or statistically abnormal:
- Testing the correlation between vote share of a party and turnout.
- Checking if the votes received by a candidate obey Benfords’s law
- Checking for disproportionate presence of 0s in the “actas”.
- Deviation from statistical laws observed in election data.
- Using machine learning algorithms to detect anomalies.